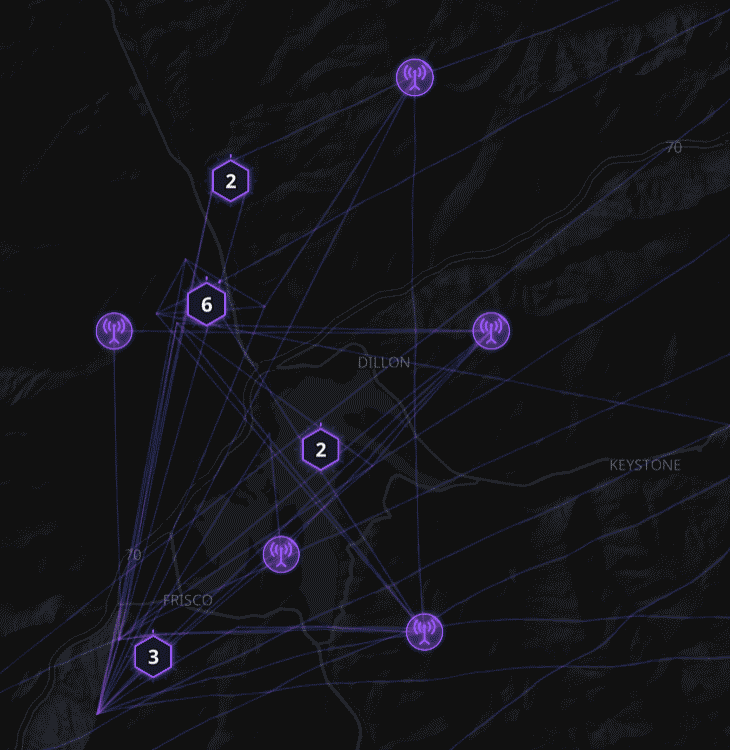
A MeshCore observer is a passive, read-only radio node on a MeshCore network that listens to local wireless traffic and sends that data over the internet to an MQTT broker. The observer does not route or repeat messages, but instead acts as the “ears” for online mapping and diagnostic tools. Summit County, Colorado now has its first Meshcore observer. In this article I describe how I built and deployed the observer, and I tell you how you can see the results of this observer in action.
The starting point for this Meshcore observer is the Heltec V4. which is a powerful IoT maker board featuring an Espressif ESP32S3 MCU and an SX1262 LoRa Node chip and a built-in wifi antenna.
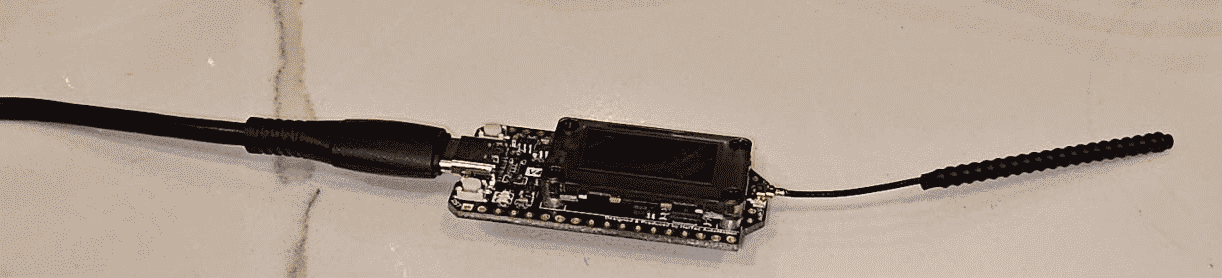
The Heltec V4 comes from the factory with the LoRa antenna seen in the photo at right. I chose to use that antenna rather than a bigger or fancier antenna, because I was able to place this observer within line of sight to several existing Meshcore repeaters.
Antenna and power. A first step is to ensure that a 915-MHz antenna with 50Ω impedance is connected to the IPEX-1 (also called UF.L) connector on the board prior to doing any transmitting. As mentioned above I chose to use the LoRa antenna provided with the board. With the antenna in place, connect this board to a USB port on (in my case) a Windows laptop computer, using a USB-C cable. This powers up the board and provides a data connection.
Flashing of firmware. Next, we flash the board with “observer” firmware from https://observer.gessaman.com/ . To do this, we use a Chrome-based browser because it has access to serial ports. (Some browsers that are not Chrome-based lack the ability to communicate with serial ports.) At the Gessaman observer web page, click on Heltec V4 and pick a role and pick a firmware version. I chose “room server” and I avoided disturbing the default selection of the firmware version. (At press time the current firmware version was v.1.16.0.36.) Check the “erase device” box.
Now put the board into DFU (device firmware update) mode. With the Heltec V4, one way to do this is to hold down the PRG button, tap the RST button, and release the PRG button. Then back at the observer web page, click “flash”. This pops up a window posing a riddle, namely “which serial port do you want?”
For those who, like me, began their descent into the Lora mesh rabbit hole at least a couple of months ago, the answer to the riddle is deceptively easy, because you will by now have faced this riddle many dozens if not hundreds of times, because by now you have done this “DFU mode” thing many dozens if not hundreds of times. Without even giving it a moment of thought, your reptile brain will automatically know where to click. But for those whose descent into this rabbit hole is more recent, the vexing task of selecting “the correct serial port” is not at all easy, because the pop-up window will likely list lots of wrong answers along with one correct answer, and nothing about the displayed list will make it clear. In my case the answer to the riddle was something like “USB JTAG/serial dbug unit (COM64)”.
One way to work out the answer to the riddle, if you are not sure, is to postpone the ritual of pressing-and-holding-PRG-and-tapping-RST-and-releasing-PRG until after you have clicked “flash”. The problem is that the “flash” pop-up window disappears after a few seconds. So you have to get the timing right, peforming the ritual almost instantly after opening the pop-up window. The answer to the riddle will be “whichever serial port disappeared and then reappeared because I performed the ritual.” I am not making this up.
Okay so you clicked “flash” and you guessed the correct answer to the riddle, and then you clicked on “connect” in the pop-up window. At this point, the pop-up window disappears as quickly as it appeared, and the web page narrates its activity, hopefully erasing the factory firmware and installing new firmware, and eventually announcing success.
Configuring the observer to connect to your wifi and to know where to send its reports. The alert reader will realize that at this point the would-be observer cannot possibly actually be performing as an observer. For one thing, as of right now, nothing has happened that would tell the device how to connect to your wifi. For another thing, the device does not yet know which LoRa radio settings to use (here, the North America settings). At this point, the device is powered up and it is running Linux, but it is not actually doing anything productive.
So now, following more instructions on the gessaman observer web page, you cast your gaze to the top center of the web page and you click on “console”. This opens another of the scary pop-up windows posing the riddle again — which serial port do you want? And the correct answer this time might be wholly different from what was the correct answer just five minutes earlier. For this riddle, one way to get the answer is simply without delay, unplug and replug the USB cable at the computer (or at the board). Once again the serial port that disappears and reappears is the correct answer to the riddle.
This opens up a terminal window with a CLI (command-line interface). The idea is that you type commands and maybe stuff happens in response to your commands.
Except not. Nothing happens in response to any command. Yes, it turns out that what you need to do now is tap that RST button again, a fact that goes unmentioned on the web page. You had to somehow already know to do this tap of the RST button. I am not making this up.
Okay having tapped the RST button, you see the terminal window refresh itself and now when you type a command, you get results. If you’re like me, this is scary because if you type the wrong thing, even by a single character being wrong, the result might be “bricking” of the device. (And by the way the riddle of “which serial port do you want?” also presents the risk of bricking whatever is at the other end of the wrong serial port that you might click on.)
You could jump into typing active commands into the CLI. But my preference is to spend a little time first in the shallow end of the swimming pool, doing harmless commands that present no “bricking” risk. My favorite harmless commands include:
- clock – in which the board tells you what time and date it thinks it is. Probably this date and time are way wrong, but this does not matter.
- board – which tells you what kind of hardware you have (here Heltec V4.3 OLED).
- ver – which tells you the current firmware version (here v.1.16.0.36).
- get this or that – you can “get” information from the board, and this is always harmless.
So for example you could type “get radio” and it will tell you what its LoRa radio settings are.
The scary risk-of-bricking-the-board command is “set”. There is much to be said for avoiding typing a “set” command with your fingers if you can instead do a copy-and-paste from a trusted source.
Here are the first few commands to type (or better, to copy and paste):
- set radio 910.525,62.5,7,5 (for most networks in the US, but I guess Southern California uses something else).
- set tx 22 (sets the transmit power at 158 mW).
- set name MyObserver (I chose Ruby-observer and only later learned that there is a local naming convention).
- set mqtt.iata XXX (This is incredibly important, it turns out. You have to set this to the three-letter code for your nearest airport. I am not making this up. In my case the correct answer was apparently EGE which means Eagle County airport.)
- set wifi.ssid YourWiFiNetwork (hopefully long ago you had set up an IOT network in your house as I describe here so this will be the SSID of your IOT network).
- set wifi.pwd YourWiFiPassword .
The gessaman observer web page says the next thing to type is “reboot”. But if you are in Colorado, as I am, it turns out that two more commands need to be typed:
- set mqtt3.preset coloradomesh
- set mqtt4.preset meshmapper
These commands make it so that the observer will send its reports not only to two mainstream analyzers called analyzer-us and analyzer-eu but will send the reports also to two analyzers that are operated by volunteers in Colorado who are connected with Colorado Mesh. I typed those last two commands and then typed “reboot”.
At this point for the very first time ever, the board’s OLED display came to life. It said things like:
- Please wait … and then …
- a Meshcore screen showing the firmware version and other very important stuff, a screen that disappeared too quickly to read all of what appears on that screen, and then …
- the name of my observer (here, Ruby-observer) and the LoRa radio settings, and then …
- after a little while, the IP address that the board had just then received from the DHCP server in my IOT wifi VLAN.
This last bit of information (the IP address) was helpful because it provided reassurance that the board had indeed successfully connected to wifi and not only that, had managed to get an IP address.
Then a white LED blinked on briefly, and then the screen went blank and stayed blank thereafter.
Let’s imagine that you might want to see all of these screens again, maybe to jot down the IP address. The way to make this happen is … tap RST again.
How you can see the results of this observer in action. The Colorado volunteers have set up two analyzers:
You can click on the first link and click on “observers” and then scroll down to the letter “R” and you can click on Ruby-observer. And you can then see, in real time, the traffic information that my observer is sending to this analyzer. And you can instantly realize that everybody else picked their observer name according to some naming convention that I knew nothing about.
You can click on the second link and click on “Map” and you can get maps like the one shown at the start of this article.
Maybe you’d like to set up your own Meshcore observer. If so, then purchase a Heltec V4 and follow the simple steps discussed above, and Bob’s your uncle.
Leave a Reply